## Gantt charts are planning tools — operational visibility is different
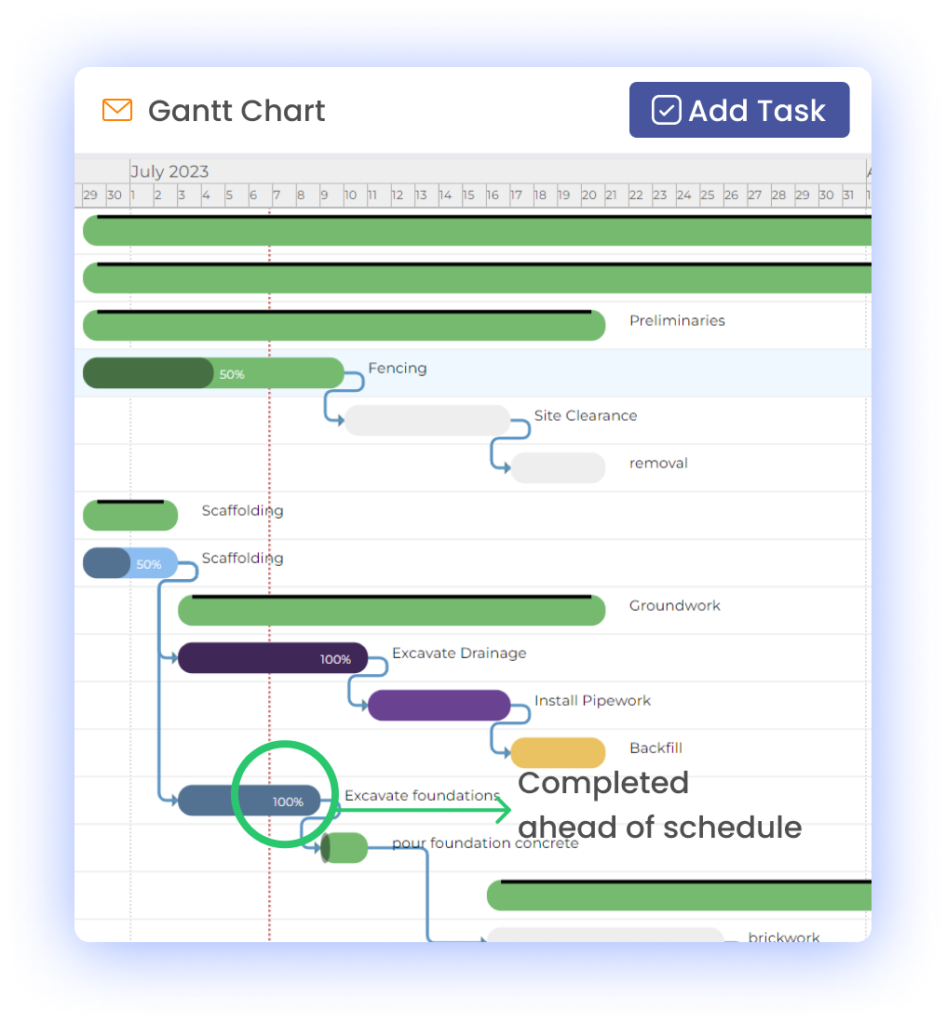
Gantt charts are excellent for planning sequences, dependencies and resource allocations. They give your team a shared timeline and make the critical path visible. But while they answer "what should happen when", they do not, by themselves, answer "what is actually happening now" or "where margin is being lost".
In practice, many service businesses tell us that Gantt charts surface plan-level issues but do not reveal the operational data you need to fix bottlenecks: actual time on task, real costs, change orders, procurement delays or subcontractor variances. That gap turns schedule problems into profit problems.
This is why bottlenecks are primarily an operational visibility problem, not a planning one. Fixing them requires connecting the plan to day-to-day execution data — and tracking cost and time at the same granularity as the Gantt stages.
## Why bottlenecks hide in the hand-off between planning and execution
A typical bottleneck lifecycle looks like this:
- A Gantt shows a delayed task or resource conflict.
- The team reacts, reallocates resources and updates the plan.
- The actual time, extra materials or subcontractor costs from the workaround are recorded elsewhere — if at all.
- By the time finance sees the impact, the project margin has slipped.
Problems here are not about the Gantt’s clarity. They are about incomplete operational data flowing back into the plan. Without precise records of planned versus actual time and cost at each Gantt stage, you cannot answer:
- Which stage eats our margin most often?
- Are delays driven by labour, materials, subcontractors or poor sequencing?
- Which corrective actions actually improve margin, not just schedule?
## Track planned vs actual time and cost at every Gantt stage
The practical fix is to track cost and time at the same granularity your Gantt uses: by stage, task or milestone.
What to capture at each stage:
- Planned hours and planned cost (labour, materials, plant, subcontractor estimates).
- Actual hours logged and actual cost invoices or receipts.
- Change order cost and time adjustments.
- Variance: actual minus planned, and percentage variance.
- Cumulative stage margin and cumulative project margin.
Why this matters:
- You can see exactly where margin is being won or lost at each stage, not just at project close.
- Stage-level variances allow targeted interventions — training, supplier change, sequencing updates.
- Trend analysis across projects highlights chronic bottlenecks that require process changes rather than ad-hoc fixes.
How to operationalise it:
- Set planned time and cost at task creation in your project plan.
- Force or automate timesheet entries to reference task IDs so actual hours map back to Gantt stages.
- Capture purchase orders and subcontractor invoices against the same task.
- Surface variances on the Gantt itself (colour coding, badges or side columns) so the plan shows execution reality.
A Gantt chart that displays both plan and actual values per stage turns a static plan into a live dashboard for margin control.
This is the core principle: a plan without live connections becomes an optimistic map, not an operating system. Connected workflows create operational visibility by ensuring that field time, procurement, change orders and invoices feed directly into the Gantt’s stages.
Practical elements of connected workflows:
- Mobile time capture linked to task IDs so field crews’ time updates stage actuals in real time.
- Purchase orders and stock reservations attached to the same task to show material readiness.
- Automated cost posting from supplier invoices to task cost lines to remove manual reconciliation.
- Alerts when a stage’s actual cost exceeds planned cost by a configurable threshold.
When these flows are connected, a delayed or over-budget stage is visible as soon as it occurs — not after finance finishes reconciliation.
## How CQ complements your Gantt charts
Gantt charts remain the right tool for sequencing and dependency planning. CQ complements them by turning stage-level plan values into live operational indicators. Our project management functionality integrates project plans with timesheets, purchase orders, change management and invoicing so that planned vs actual comparisons are automatic and auditable.
If you want to review how CQ links plan and execution in practice, our project management features are explained on the product page: https://www.cq-business-management-software.com/project-management-software/. That page shows how tasks, resources and cost lines are structured so every Gantt stage carries financial and time context.
If you prefer to see a real-world example, you can request a hands-on demonstration tailored to field operations and project workflows here: https://www.cq-business-management-software.com/landscaping-demo/. Across demonstrations we focus on how stage-level variances and bottleneck alerts translate into actionable changes on-site and in the office.
If you are evaluating tools and want a framework to choose the right system for your team’s operational needs, this guide explains the criteria to consider: https://www.cq-business-management-software.com/how-to-choose-job-management-software/. It emphasises the need for connected workflows and stage-level cost visibility — the same capabilities that turn Gantt plans into operational control.
## Practical checklist: how to use Gantt + operational data to remove bottlenecks
Use this checklist to convert Gantt insights into margin improvement:
- Define stage-level planned hours and planned cost when you build the Gantt.
- Require timesheets to reference task or stage IDs; eliminate orphan time entries.
- Attach purchase orders and subcontractor agreements to tasks so materials and services show up against the stage.
- Track change orders against the originating stage and publish variance reports daily or weekly.
- Surface stage variances directly on the Gantt (colour, icons, comments) so planners see execution reality at a glance.
- Create automated alerts for thresholds: hours > planned by X%, cost > planned by Y%.
- Run a weekly stage-level margin review — focus on stages with repeated overruns.
## What to expect when you close the visibility gap
When you combine Gantt planning with stage-level cost and time tracking:
- You stop guessing where margin is lost; you see it and can act.
- Bottlenecks change from firefighting items to data-driven process improvements.
- Decision-making shifts from anecdote to evidence: which subcontractor, which supplier or which stage needs a new approach.
- Your replanning is informed by actuals, reducing repeat overruns and protecting margin.
Gantt charts are a vital part of project planning. To manage bottlenecks effectively, pair them with connected operational workflows that capture planned vs actual time and cost at each stage. That combination turns schedule visibility into profit protection and predictable delivery.
Project management is a complex endeavor that requires careful planning, resource allocation, and tracking of progress. Two commonly used tools in project management are Gantt charts and traditional timelines. Both methods have their strengths and weaknesses, and choosing the right one can significantly impact the success of a project. In this article, we will conduct a comparative analysis of Gantt charts and traditional timelines to help you make informed decisions about which approach to use in your projects.
Introduction to Gantt Charts and Traditional Timelines
Gantt Charts
Gantt charts are graphical representations of project schedules that display tasks and their respective timelines. They provide a visual overview of project activities, dependencies, and resource allocation. Gantt charts are widely used for their ability to offer a clear and detailed view of a project's progress.
Traditional Timelines
Traditional timelines, on the other hand, are simple, linear representations of project schedules. They display tasks sequentially without the complexity of task dependencies. While they lack the visual sophistication of Gantt charts, traditional timelines are straightforward and easy to create.
Advantages of Gantt Charts
Gantt charts offer several advantages:
1. Visual Clarity
Gantt charts provide a visual representation of project timelines, making it easy to understand the project's progress at a glance.
2. Task Dependencies
They allow you to depict task dependencies, showing which tasks must be completed before others can start.
3. Resource Allocation
Gantt charts help in resource allocation by showing who is responsible for each task and when they are assigned to it.
Real-World Example:
Imagine you're managing a construction project with multiple teams. A Gantt chart would help you see which tasks are dependent on the completion of others, ensuring that resources are allocated efficiently.
Disadvantages of Gantt Charts
However, Gantt charts also have limitations:
1. Complexity
They can become complex for large projects with numerous tasks, potentially overwhelming users.
2. Potential for Inaccuracy
Gantt charts may become inaccurate if updates aren't made promptly, leading to misleading information.
Real-World Example:
In large-scale infrastructure projects, managing a Gantt chart with hundreds of tasks can be challenging and time-consuming.
Advantages of Traditional Timelines
Traditional timelines have their own set of advantages:
1. Simplicity
They are simple and easy to create, making them accessible to all team members, even those without extensive project management experience.
2. Ease of Use
Traditional timelines require minimal training, making them ideal for projects where simplicity and quick setup are essential.
Real-World Example:
In a small marketing campaign with straightforward tasks, a traditional timeline can provide a clear overview of the project's progress.
Disadvantages of Traditional Timelines
However, traditional timelines also come with limitations:
1. Limited Task Relationship Visualization
They lack the ability to depict task dependencies and resource allocation, which can lead to oversight.
2. Resource Management Challenges
Traditional timelines may not help in effectively managing resources, potentially causing bottlenecks.
Real-World Example:
In software development projects with complex interdependencies, a traditional timeline may not provide sufficient visibility into task relationships.
When to Use Gantt Charts vs. Traditional Timelines
The choice between Gantt charts and traditional timelines depends on the specific needs of your project:
Use Gantt Charts When:
Your project is large and complex with many interdependent tasks.
You need detailed resource allocation and task management.
Stakeholders require a visual representation of project progress.
Use Traditional Timelines When:
Your project is small, simple, and doesn't involve extensive dependencies.
Quick setup and accessibility for all team members are crucial.
A simplified overview of project progress is sufficient.
Conclusion
In the world of project management, choosing between Gantt charts and traditional timelines is not a one-size-fits-all decision. Both have their merits and drawbacks. Understanding your project's specific requirements and complexity is crucial to making an informed choice. Gantt charts offer comprehensive project management capabilities, while traditional timelines provide simplicity and accessibility. By selecting the right tool, you can enhance your project's chances of success and ensure that your team works effectively and efficiently.
Project management is an intricate dance of tasks, timelines, resources, and dependencies. To orchestrate this dance seamlessly, project managers often turn to Gantt charts. These visual tools provide a clear overview of project schedules and help in managing project complexities. However, creating a Gantt chart is just the first step; optimizing it for efficiency is where the magic happens.
Understanding Gantt Charts
Before we dive into optimization, let's briefly understand what Gantt charts are. Named after their inventor, Henry L. Gantt, Gantt charts are visual representations of project schedules. They display tasks, timelines, and task dependencies in a horizontal timeline format. Each task is represented as a bar, and the length of the bar indicates its duration. Task dependencies are shown through lines connecting the bars.
The Importance of Optimization
Optimizing a Gantt chart isn't just a matter of aesthetics; it's about improving project management efficiency. An optimized Gantt chart can lead to better resource allocation, time management, and overall project success. Here are some tips to help you make the most of your Gantt charts:
1. Task Breakdown: Break down complex tasks into smaller subtasks. This makes your Gantt chart more manageable and allows for more accurate tracking of progress.
2. Dependency Management: Clearly define task dependencies. Understanding which tasks rely on others is crucial for project planning and execution.
3. Resource Allocation: Assign resources judiciously. Avoid overloading team members with too many tasks and ensure that resources are allocated efficiently.
4. Timeline Adjustments: Be prepared to adjust timelines. Projects rarely go exactly as planned, so make sure your Gantt chart is flexible enough to accommodate changes and delays.
5. Color-Coding and Labels: Use visual cues like color-coding and labels to distinguish between task types, priority levels, or team members. This enhances chart readability.
6. Regular Updates: Keep your Gantt chart up to date. As the project progresses, make sure your chart accurately reflects the current status, deadlines, and dependencies.
Gantt Chart Software
To implement these tips effectively, you can turn to various project management software tools that offer Gantt chart capabilities. Some popular options include Microsoft Project, Trello, Asana, and Smartsheet. These tools often come with additional features like collaboration, task assignment, and reporting, making project management more efficient.
Real-Life Examples
To illustrate the impact of Gantt chart optimization, let's look at a real-world example. Company X, a software development firm, used Gantt charts to plan a complex project with multiple development teams. By regularly updating the Gantt chart, they identified potential bottlenecks and resource constraints early on. This allowed them to allocate resources more effectively, adjust timelines when necessary, and ultimately deliver the project ahead of schedule.
Conclusion
In the world of project management, Gantt charts are indispensable tools. However, their true potential is unlocked when they are optimized for efficiency. By following these tips and embracing the flexibility of digital tools, you can enhance your project management skills and lead your team to success.
## The visibility problem on major projects
Large projects fail on predictable problems: clashing schedules, unclear handovers, and last-minute resourcing decisions. Teams still rely on spreadsheets, messages and whiteboards to coordinate dozens of interdependent tasks. The result is wasted labour, idle plant and avoidable delays.
In our experience working with construction firms, the single biggest blocker is fragmented planning — office teams plan in isolation from field teams, and no one has a reliable view of the true project programme.
## Why integrated planning tools matter
Connected planning tools replace fragile point solutions with a single source of truth. They make dependencies explicit, automate updates and expose constraints early. Connected workflows create operational visibility — when work orders, schedules and resources flow between systems, you can see the impact of a change across the whole programme immediately.
That visibility changes decisions from reactive to deliberate. Project managers can:
- Identify critical-path tasks and protect them from ad-hoc resource moves.
- Sequence deliveries so materials arrive when operatives are ready to use them.
- Allocate crews and plant by skill and availability, not by guesswork.
- Track progress in real time so finance and operations share the same story.
## How Gantt charts and integrated workflows fix common problems
A Gantt chart alone is a planning tool; connected to job management it becomes an execution tool. When tasks on the Gantt are linked to live job records, updates cascade automatically: a delayed inspection moves follow-on tasks, and crews receive updated call-outs without an administrator re-entering information.
Concrete benefits for your team include:
- Fewer site standstills because subcontractors and deliveries are sequenced against actual progress.
- Reduced double-bookings by synchronising crew calendars and plant logs.
- Faster responses to change orders since the downstream impact is visible at the point of decision.
- Better margin control as delays and extra work are captured and billed more consistently.
## Practical changes that reduce delay and cost
Start with three operational changes that produce immediate returns:
1. Replace disparate schedules with one programme that links master tasks to job-level work.
2. Make status updates mandatory at job milestones so the programme updates automatically.
3. Use resource pools and skills profiles to match work to available crews rather than names on a spreadsheet.
These changes are practical, not theoretical. Across hundreds of demonstrations with growing service businesses, we consistently see those steps shave days — not just hours — off project timelines and reduce back-and-forth communications.
## What to look for when selecting a solution
Not every tool delivers integration. When you evaluate systems, focus on:
- Native job management that ties orders, invoices and site notes to the programme.
- Real-time mobile updates for operatives so the office doesn’t rely on end-of-day reports.
- Simple resource management that handles multi-day shifts, travel time and plant allocation.
If you need a straightforward comparison to guide procurement, read our guide on [how to choose job management software](https://www.cq-business-management-software.com/how-to-choose-job-management-software/) for the criteria that matter in operational terms.
## Seeing it in practice
To assess how integrated planning plays out on real projects, review product functionality and a live demo. Our product overview explains how office and field workflows are connected on a single platform: [CQ Business Management Software](https://www.cq-business-management-software.com/). For a focused demonstration of field scheduling, route planning and Gantt-driven allocation, view the [landscaping demo](https://www.cq-business-management-software.com/landscaping-demo/) to see the same features applied to multi-site programmes.
## Make planning operational, not aspirational
The failure mode for most projects isn’t a lack of effort — it’s a lack of integration. Move away from manual reconciliation and create one operational picture that your whole team uses. That turns planning from a static document into an active tool that prevents delays, protects margins and keeps projects on programme.
## Understanding the Gantt Chart
A Gantt chart is a visual schedule: tasks shown as bars across a timeline, with start and end dates, durations, and links that represent dependencies. It makes the sequence of work visible at a glance and highlights which tasks are critical to a finish date. For planners it is a practical blend of calendar and logic — who does what, when, and in what order.
Used correctly, a Gantt chart remains one of the most effective planning tools available. The challenge is expecting it to manage every operational process that follows.
## When It Works Well
Gantt charts deliver value where time and sequence matter. Practically, they work best when you need to:
- Visualise a project timeline and communicate it to stakeholders.
- Show dependencies so teams understand what must finish before the next work begins.
- Set baselines and compare planned dates with actuals to spot schedule drift.
- Coordinate multi-trade or multi-team projects where sequencing is the risk driver.
- Illustrate milestones for client reviews or regulatory checkpoints.
Strengths are concrete: clarity, simple dependency logic, and an at-a-glance view of slippage or critical-path pressure. For planning meetings and client briefings a Gantt can stop arguments about “what’s next” because the sequence is explicit.
## Where It Needs Support
A Gantt chart describes time and sequence; it does not operate the job. That’s not a criticism — it’s a definition of scope. Where the Gantt needs complementary systems is operational depth:
- Scheduling granularity: a Gantt shows a task as a block of days. It doesn’t allocate individuals, record shift patterns, or manage multi-day site rotations without extra layers of scheduling logic.
- Resource management: the chart can mark a resource conflict, but it won’t resolve it. You still need a system that understands skills, availability, and priorities.
- Site communication: field teams need current instructions, change notifications and access to job records on mobile — a static chart is rarely enough.
- Variations and change orders: the Gantt can extend a task, but it won’t produce a variation quotation, log approvals or adjust cost forecasts automatically.
- Profitability and cashflow: schedule slippage can erode margin. A chart won’t show the real-time impact on costs, purchase orders, committed spend or invoicing.
- Multiple versions and collaborations: Gantt plans frequently diverge into copies — one for the client, one for the office, one for site. That duplication is where mistakes and missed changes occur.
In short: Gantt charts set the plan. The next step beyond scheduling is connecting that plan to the people, purchases and billing that determine whether a job is profitable.
## Task Management — Connected
A task on a Gantt chart must be more than a bar; it should be an actionable, connected unit of work.
What that looks like in practice:
- Tasks link to job records so every activity carries a job number, scope and client detail.
- Each task exposes a checklist that crews can follow and check off on mobile devices.
- Time entries map back to tasks so labour costs are recorded against the same element shown on the Gantt.
- Tasks show current status (not started, in progress, blocked, complete) and the reason for delays.
- Attachments — plans, photos, safety documentation — live with the task, so the chart is not just a picture but the control point for work.
This is where planning becomes execution. When your project management approach connects the Gantt bar to a live task record, the office and site stop working from different truths. Your team can see the plan and act on it; administrators can measure progress without manual reconciliation.
Working with growing service businesses, we often see that the firms who link tasks to operational records reduce rework and late labour claims. That connection prevents time from becoming an abstract estimate and makes it measurable.
## Connected to Invoice Milestones
A schedule without billing logic is a promise without a payment path. Many service businesses use milestone-based billing: stage completions, practical completion, holdbacks, retentions. The Gantt can mark those milestones, but turning them into invoices requires connection.
Practically speaking you need a workflow that:
- Triggers a milestone invoice or progress claim when a defined task or set of tasks reaches a % complete.
- Captures proof-of-work — photos, site sign-offs, timesheets — and attaches it to the invoice for client queries.
- Tracks retention and release schedules aligned to contractual terms displayed on the project schedule.
- Manages variation approvals so scope changes update both the Gantt and the billing plan.
When milestones live in a connected system you reduce billing delays and disputes. The Gantt remains the customer-facing timeline, while the job management system ensures that completed stages generate the revenue they represent.
If you want to see how a job-management solution links scheduling, progress and billing, explore how CQ connects these elements on our [project management software page](https://www.cq-business-management-software.com/project-management-software/).
## Financial Tracking
A Gantt chart shows planned time. Profitability depends on how well you track the costs that flow through that time window.
The difference between a static plan and real-time job costing is the difference between a forecast and a control system. Items to manage:
- Labour costs: timesheets mapped to tasks provide accurate actuals and reveal overtime or idle time that impacts margin.
- Material costs: purchase orders, delivery confirmations and goods-received records must be associated with the job and with the schedule point when they’re consumed.
- Plant and equipment: allocation, utilisation and hire costs should be visible against the same task the Gantt shows.
- Committed spend and variations: logged commitments and approved variations update forecast profit in real time.
- Cost-to-complete forecasting: updating the plan with actuals allows forecasted margin to move from spreadsheet guesswork to a live metric.
Real-time financial tracking requires integration between schedule, procurement, payroll and invoicing. Without that, your Gantt can show the finish date, but you won’t know whether finishing on time means finishing in profit.
When choosing job management software, treat financial tracking as a primary criterion — read this guide to get the questions right: https://www.cq-business-management-software.com/how-to-choose-job-management-software/.
In our experience working with service firms, the most common profitability surprise is not a single large cost overrun but small, uncaptured items and delayed invoicing that compound. Connecting time and costs at task level makes those leaks visible and fixable.
## Connected Workflows
Schedules don’t operate in isolation. The most reliable projects are those where the plan is the starting point for automated workflows that keep everyone aligned.
Examples of these workflows:
- When a task is marked complete on site, a timesheet and photo upload triggers a stage-ready notification and prepares a draft invoice.
- If a material delivery slips, the system resurfaces affected tasks and alerts the planner to re-sequence work or reallocate crews.
- Safety sign-offs prevent a task from moving to “complete” until a check is recorded, ensuring no milestone payment is requested prematurely.
- A variation approved by the client automatically updates the job budget, the Gantt duration and the invoice schedule.
These are not theoretical. Across our demonstrations and implementations we show how a Gantt-driven plan combined with connected workflows converts schedule changes into controlled invoices, adjusted cost forecasts and clear site instructions.
CQ Business Management Software is designed to be that complement — the system that takes the plan the Gantt provides and binds it to timesheets, purchase orders, invoicing and field collaboration. You can explore how that connection looks for service teams on the [project management software page](https://www.cq-business-management-software.com/project-management-software/).
Use cases to consider:
- Small teams scaling to multiple concurrent jobs: automation reduces admin and keeps site teams focused on work rather than paperwork.
- Jobs with staged payments: automated milestone billing shortens cash-collection cycles.
- Projects with repeated variations: creating standard variation workflows reduces approval friction and captures margin.
The right software does not replace the Gantt. It accepts the Gantt as the plan and provides the operational rails so that plan turns into profitable delivery.
## Practical Steps to Combine Gantt Plans with Operational Systems
If your business uses Gantt charts and wants to protect margin as you scale, the practical steps are:
1. Link tasks to jobs
- Ensure every Gantt task resolves to a job record containing scope, client, contract terms and cost allowances.
2. Capture actuals at task level
- Require timesheets, delivery confirmations and site photos to be recorded against tasks before they move state.
3. Automate milestone billing
- Define invoice triggers in the system: task completion + required evidence = invoice ready.
4. Manage variations inside the workflow
- Make variations a formal part of the job record with approval steps that update both plan and budget.
5. Use capacity-aware scheduling
- Move beyond visual checks by integrating crew availability and skill sets into the scheduling layer.
6. Keep one version of truth
- Avoid duplicated Gantt files; make the schedule the single live source and connect stakeholders through permissions and role-based views.
These steps reduce reliance on manual reconciliation between the plan and operations, cutting the lead time between completion and payment and protecting margin.
## Conclusion / CTA
A Gantt chart will always be a core planning tool. Used correctly, a Gantt chart remains one of the most effective planning tools available. The challenge is expecting it to manage every operational process that follows. For healthy growth, your team needs the next step beyond scheduling: a connected operational system that links tasks to time, cost and cashflow.
Across hundreds of demonstrations with growing service businesses, we consistently see that businesses which combine clear scheduling with connected workflows collect sooner, forecast reliably and protect margin.
If you want to see that combination in action, book a demonstration tailored to your team: https://www.cq-business-management-software.com/landscaping-demo/. For a full overview of how the pieces fit together, visit our [project management software page](https://www.cq-business-management-software.com/project-management-software/).
If you’re evaluating software, use an evidence-led checklist — start with the “how to choose” guide we maintain to ensure the system supports scheduling, operational execution and financial control: https://www.cq-business-management-software.com/how-to-choose-job-management-software/.
Gantt charts, a visualization tool introduced by Henry L. Gantt in the early 20th century, have long been the go-to choice for project managers and planners. These bar charts provide a visual representation of a project's timeline, tasks, and dependencies, making project management more accessible and efficient. However, in today's rapidly evolving digital landscape, Gantt charts are adapting to new technologies and trends to remain relevant and effective. In this article, we'll explore the predicted trends and innovations that are shaping the future of Gantt charts.
The Evolution of Gantt Charts: A Brief Overview
Before diving into the future, it's essential to understand the history of Gantt charts. Originally designed for manufacturing processes, Gantt charts have evolved to become a fundamental tool in various industries, from construction and software development to marketing and event planning.
The Current State of Gantt Charts
As of now, Gantt charts continue to play a crucial role in project management. They provide a visual timeline that helps project managers allocate resources, manage dependencies, and track progress. However, the digital age has brought both challenges and opportunities to this time-tested tool.
Challenges Faced by Traditional Gantt Charts
Traditional Gantt charts have limitations. They can be challenging to update in real time, making them less suitable for dynamic projects or agile methodologies. The static nature of these charts also hinders collaboration and remote work, which has become increasingly common in today's business landscape.
Predicted Trends in Gantt Chart Technology
The future of Gantt charts looks promising, thanks to several predicted trends:
1. Real-time Collaboration and Remote Work
To meet the needs of remote teams, Gantt chart software is incorporating real-time collaboration features. This allows team members to update tasks, share comments, and collaborate seamlessly, regardless of their physical location.
2. Integration with Other Project Management Tools
Modern Gantt chart tools offer enhanced visualization options and increased customization. Project managers can tailor charts to their specific needs and present data in more visually appealing ways.
4. Predictive Analytics and AI-Driven Insights
Artificial intelligence (AI) is making its way into Gantt charts, providing predictive analytics and data-driven insights. This empowers project managers to make informed decisions and foresee potential roadblocks.
5. Mobile-Friendly Gantt Charts
With the rise of mobile work, Gantt chart applications are becoming mobile-friendly. Team members can access and update charts on their smartphones, ensuring flexibility and accessibility on the go.
Challenges and Considerations
While the future of Gantt charts is promising, challenges exist. Project managers must carefully consider factors like data security, software compatibility, and team training when adopting new Gantt chart technologies. Moreover, striking the right balance between customization and complexity is essential.
Conclusion: The Future is Bright
As we look ahead, the future of Gantt charts appears bright and dynamic. These visual tools are evolving to meet the demands of the digital age, providing project managers with enhanced capabilities for planning, tracking, and collaboration. By staying current with these trends and innovations, businesses can harness the full potential of Gantt charts to drive project success in the years to come.
In the fast-paced world of business, where efficiency and productivity are paramount, the way we create and manage documents has undergone a remarkable transformation. The shift from traditional paper-based processes to digital document management has not only streamlined operations but has also revolutionized how organizations function. This article takes you on a journey through the digital evolution of document creation and management, highlighting the benefits, tools, and trends that have shaped this essential aspect of modern business.
The Traditional Document Landscape
Before delving into the digital era, it's essential to understand the challenges posed by traditional document management. Physical documents, while the norm for centuries, presented numerous hurdles for businesses. Limited storage space, difficulties in accessibility, and the constant threat of loss or damage were persistent issues. Countless man-hours were spent organizing, filing, and searching for paper documents.
The Digital Revolution
The advent of technology marked a turning point. With the proliferation of computers and the internet, businesses began migrating towards digital document creation and management. Word processing software like Microsoft Word and digital file formats such as PDF made it possible to create, share, and store documents electronically.
Benefits of Going Digital
Cost Savings: Printing, paper, and physical storage costs dwindled as digital documents became the norm.
Accessibility: Documents could be accessed and edited remotely, enabling collaboration regardless of geographical boundaries.
Remote Work: The rise of remote work was made possible by digital document sharing and collaboration tools.
Document Creation Tools
Today, a plethora of digital document creation tools are available. Microsoft Word, Google Docs, and Adobe Acrobat are just a few examples. These tools offer a wide range of features, from text formatting to image embedding and collaborative editing. They have become indispensable for businesses of all sizes.
Tips for Efficient Document Creation
To maximize the benefits of these tools:
Use templates to maintain consistency.
Leverage formatting styles for a professional look.
Collaborate in real-time with colleagues or clients for seamless editing.
Document Management Systems (DMS)
Document Management Systems (DMS) have emerged as the backbone of modern document management. These platforms provide centralized storage, version control, and advanced search capabilities. They empower organizations to organize and access their documents efficiently.
Real-world Impact
For example, a construction company streamlined its operations by implementing a DMS. It allowed them to organize blueprints, project timelines, and contracts systematically. This improved project management and reduced errors, ultimately leading to cost savings.
Ensuring Security and Compliance
As businesses went digital, ensuring document security became paramount. Encryption, access control, and compliance with regulations like GDPR and HIPAA are critical components of secure document management. Compliance is not just about avoiding fines; it's about safeguarding sensitive information and maintaining trust with clients and partners.
Future Trends and Innovations
The journey of document creation and management doesn't stop here. Emerging trends are set to reshape this landscape once again. Artificial intelligence (AI)-driven document automation promises to automate repetitive tasks, while blockchain-based document verification ensures the authenticity of digital documents.
Conclusion
The digital evolution of document creation and management has been nothing short of revolutionary. It has propelled businesses into an era of heightened efficiency, accessibility, and security. To remain competitive, it's crucial for organizations to continually adapt to emerging technologies and best practices in this field. Embracing the digital transformation of document management isn't just a choice—it's a necessity in the modern business landscape.
Time is a precious resource in today's fast-paced business world. Efficiently managing and tracking employee hours has become crucial for organizations of all sizes. Gone are the days of manual punch cards and paper logs. The digital age has ushered in a new era of time tracking with the introduction of the digital clock.
Section 1: The Evolution of Time Tracking: From Punch Cards to Digital Clocks
Time tracking has a long history dating back to the industrial era when employees used punch cards to record their work hours. However, these manual methods were prone to errors and often required significant administrative effort. As businesses grew and technology advanced, it became clear that a more accurate and efficient solution was needed.
Enter digital clocks, which have revolutionized the way we track time. Unlike punch cards and manual logs, digital clocks offer precision and convenience. They eliminate the need for physical timecards and the risk of human error. Instead, employees can simply clock in and out electronically, saving both time and effort.
Section 2: Features and Benefits of Digital Clocks in the Workplace
Digital clocks come with a range of features designed to enhance time tracking in the workplace. These features include:
Accuracy: Digital clocks ensure precise time recording, reducing discrepancies in payroll calculations.
Convenience: Employees can easily clock in and out with a simple touch or swipe, making the process quick and hassle-free.
Automation: Digital clock systems automate time tracking, reducing the need for manual data entry.
Reporting: Employers can generate detailed reports, helping them gain insights into employee hours and productivity.
The benefits of digital clocks extend to both employees and employers. Employees appreciate the simplicity and accuracy, while employers enjoy increased productivity and reduced administrative burdens.
Section 3: Integration with Payroll and HR Systems
One of the standout advantages of digital clock timesheets is their seamless integration with payroll and HR systems. This integration streamlines payroll processes and reduces the likelihood of errors. With data flowing directly from the digital clock to payroll software, there's no need for manual data entry, reducing the risk of mistakes and saving time.
Real-world examples demonstrate the value of this integration. Companies that have embraced digital clocks have reported significant improvements in their payroll accuracy and efficiency. For businesses with a large workforce, this can translate into substantial cost savings.
Section 4: Enhancing Compliance and Accountability
Digital clocks play a critical role in helping businesses comply with labor laws and regulations. By accurately recording employee hours and breaks, organizations can ensure they are following the law. This not only reduces the risk of legal issues but also fosters a culture of compliance within the workplace.
Furthermore, digital clocks promote employee accountability. When workers know their hours are being accurately tracked, they are more likely to adhere to company policies and regulations. This increased accountability benefits both employers and employees.
Section 5: Overcoming Challenges and Concerns
While digital clocks offer numerous advantages, there are also concerns to address. Some employees may be wary of privacy and data security issues associated with electronic time tracking. To overcome these challenges, it's essential to implement robust data protection measures and provide employees with clear explanations of how their data will be used and protected.
Effective change management strategies can help ease the transition to digital clocks, particularly if there is resistance among employees. Training programs and ongoing support are crucial for a smooth adoption process.
Section 6: Real-world Success Stories
Real-world success stories highlight the transformative impact of digital clock technology. Companies that have embraced this modern time tracking method have experienced increased accuracy, cost savings, and improved workforce management.
The digital clock has emerged as a game-changer in modern workplaces, offering precision, convenience, and efficiency in time tracking. Its integration with payroll and HR systems, compliance-enhancing capabilities, and accountability benefits make it an indispensable tool for businesses of all sizes. As the digital age continues to evolve, digital clocks will remain at the forefront of time tracking solutions, driving productivity and accuracy in the workforce.
Agile project management is renowned for its adaptability and customer-centric approach, allowing teams to respond to changing requirements and deliver value quickly. In contrast, Gantt charts have long been associated with traditional project planning methods characterized by detailed schedules and fixed timelines. However, the synergy between Agile and Gantt charts may surprise you. In this article, we'll explore the role of Gantt charts in Agile project management and how they can complement each other to improve project planning and execution.
Understanding Agile Project Management
Agile project management is a methodology that prioritizes iterative development, customer collaboration, and the ability to adapt to changing circumstances. Originally popularized in software development, Agile principles have found applications in various industries. Key features of Agile include:
Iterative Development: Agile projects are divided into small, manageable iterations, each delivering a potentially shippable product increment.
Customer Collaboration: Agile teams involve customers and stakeholders throughout the project to ensure alignment with their needs.
Adaptability: Agile embraces change, allowing teams to pivot and adjust project priorities based on emerging requirements or market shifts.
The Traditional Role of Gantt Charts
Gantt charts, on the other hand, have a rich history in project management. Developed by Henry L. Gantt in the early 20th century, these charts provide a visual representation of project schedules. Key features of Gantt charts include:
Detailed Planning: Gantt charts break down projects into tasks and subtasks, assigning start and end dates to each.
Dependency Visualization: They illustrate task dependencies, helping project managers identify critical paths and potential bottlenecks.
Resource Allocation: Gantt charts enable efficient allocation of resources by showing who is responsible for each task.
The Challenge of Integrating Agile and Gantt Charts
At first glance, Agile's flexibility seems at odds with the rigidity of Gantt charts. Agile promotes changing requirements, while Gantt charts appear to lock project schedules in stone. Common challenges organizations face when integrating the two methodologies include:
Resistance to Change: Teams accustomed to Agile may resist the perceived constraints of Gantt charts.
Overly Detailed Plans: Gantt charts can lead to excessively detailed planning, which contradicts Agile's focus on minimal documentation.
Maintaining Flexibility: Finding the balance between Agile's adaptability and Gantt charts' structure can be challenging.
Finding Synergy
Despite the challenges, organizations can harness the strengths of both Agile and Gantt charts. Here's how:
High-Level Planning: Use Gantt charts for high-level project planning, outlining major milestones and dependencies.
Detailed Agile Execution: Within Agile iterations or sprints, teams can employ Agile methodologies for day-to-day project execution.
Communication: Maintain open communication between teams using both methodologies to ensure alignment and flexibility.
Real-World Examples
Several organizations have successfully integrated Gantt charts into their Agile workflows, reaping the benefits of this synergy. For example:
Software Development: A software development company used Gantt charts to create a high-level project roadmap while employing Agile for sprint planning and execution. This approach improved project visibility and stakeholder communication.
Trello: Trello's Power-Ups allow users to add Gantt charts and timeline views to boards, facilitating Agile planning.
Best Practices
Implementing Gantt charts in an Agile environment requires careful consideration. Here are some best practices:
Team Training: Ensure teams are proficient in both Agile and Gantt chart methodologies.
Communication: Maintain open lines of communication between Agile teams and stakeholders to manage changes effectively.
Maintaining Agility: Remember that the goal is not to stifle Agile's flexibility but to enhance project planning and visibility.
Conclusion: While Agile and Gantt charts may appear contradictory, they can work harmoniously to enhance project planning and execution. By using Gantt charts for high-level planning and Agile for detailed execution, organizations can enjoy the benefits of both methodologies. This integration fosters better project visibility, communication, and adaptability, ultimately leading to more successful project outcomes.
## Why operational efficiency determines profit
Profit in field service and project-based work is not a by-product of hard work — it is the result of predictable, repeatable processes. When teams lack clarity over work, materials and costs, margins disappear through rework, wasted travel time and uncontrolled change. That is the problem most service businesses face: good revenue but inconsistent profit.
Across hundreds of demonstrations with growing service businesses, we consistently see the same gaps: fragmented systems, paper-based processes and late change notifications. Fixing those gaps is not about working harder; it is about working smarter.
## The root causes of margin leakage
If your jobs routinely miss budgets, look for these operational issues:
- Disconnected systems that force double-entry and hide actual costs until after completion.
- Poor onsite-to-office communication so labour and materials are under- or over-reported.
- No single source of truth for job scope and change control, which creates disputes and discounting.
- Reactive scheduling that increases travel time and underutilises crews.
These are operational problems, not sales problems. Solve them and profit improves immediately.
## The single most important change: connect workflows
Connected workflows create operational visibility
When quoting, scheduling, onsite execution and invoicing live in a single flow, your team sees the true cost of every job in real time. That visibility lets managers spot overruns earlier, reduce disputes and enforce agreed scope.
What connected workflows deliver:
- Accurate job profitability per job, not just at month end.
- Fewer variations and faster approvals for change work.
- Reduced administration by eliminating duplicate data entry.
- Better utilisation of labour and plant through intelligent scheduling.
You can see how a single platform brings these elements together at https://www.cq-business-management-software.com/.
## Practical steps to improve efficiency this quarter
Start with these actions — they are operational and measurable:
1. Map your current job lifecycle from enquiry to invoice.
- Identify where handoffs occur and where data is re-entered.
2. Standardise job packs and change-control forms.
- Make acceptance of scope and variations mandatory before work proceeds.
3. Introduce mobile capture for timesheets and materials.
- Reduce end-of-week guesswork and late adjustments.
4. Implement a daily schedule with assigned tasks and travel routing.
- Cut travel time and idle labour.
5. Review procurement and stock movement weekly.
- Track the costs tied to each job in real time.
These are not theoretical improvements — they are repeatable operational changes that deliver margin gains.
## What success looks like
Measure the impact with a few simple KPIs:
- Job-level gross margin (target improvement: 3–7% within three months).
- Number of variations logged and approved before work starts.
- Admin hours per job reduced by automation.
- Average response and travel time per job.
In our experience working with service businesses, the firms that adopt these measures gain control of margin leakage and convert revenue growth into sustainable profit.
## Choose the right tools, deliberately
Software is not a silver bullet but it is the multiplier. When evaluating solutions, focus on whether the product:
- Unifies quoting, scheduling, onsite capture and invoicing.
- Offers mobile-first capture for field teams.
- Produces clear job-cost reporting without manual reconciliation.
For a practical checklist on selecting job management software, read https://www.cq-business-management-software.com/how-to-choose-job-management-software/. If you want to assess fit for your team and see the workflows in action, request a tailored walkthrough at https://www.cq-business-management-software.com/landscaping-demo/.
## Next step
If your priority is converting billable hours into predictable profit, start by mapping one problem process and enforcing a connected workflow for it. For an example of how platforms bring these workflows together and to evaluate whether it will work for your business, review the platform details at https://www.cq-business-management-software.com/ and book a demonstration to see the impact on your margins.
Operational efficiency is not an optional improvement — it is the backbone of profitable projects. Take control of your workflows, and the profit follows.
## Why Gantt charts matter for project managers
Gantt charts give project managers a clear, visual schedule. They make sequencing explicit, highlight dependencies, and show the critical path in a single view. That clarity reduces ambiguity when you set dates, assign tasks and brief stakeholders.
Key strengths of Gantt charts for project managers:
- Visualising dependencies and critical path so delays and constraints are obvious.
- Communicating timelines and milestones to clients and internal teams.
- Planning allocation of resources across tasks in a single timeline.
- Creating a baseline plan against which progress can be measured.
- Simplifying stakeholder conversations by showing what must happen, when.
These are core project management skills. Gantt charts are effective planning tools, and they should remain part of a PM’s toolkit.
## The limits of a standalone Gantt in day-to-day operations
A Gantt chart shows a plan. It does not, by itself, run work or close the loop between planning and execution. That gap becomes visible as your projects scale and complexity increases.
Common problems PMs face with standalone Gantts:
- Plans go stale quickly because field updates aren’t reflected automatically.
- Scheduling ignores real-time availability, skills, or equipment constraints.
- Changes require manual, error-prone re-planning and communication.
- No direct link to time capture, job costing or invoicing for financial control.
- Handoffs between office and field are managed by email, spreadsheets or phone calls.
- Reporting requires manual consolidation from multiple sources.
Working with project managers across service industries, we regularly see these operational gaps cause schedule slippage, double-bookings and billing delays.
A Gantt is indispensable for planning. But without operational connections it becomes a static plan rather than a reliable source of truth.
## What project managers gain when Gantt charts are part of a connected system
Connected workflows create operational visibility
When a Gantt chart sits inside a connected system — where scheduling, resource management, field updates, timesheets and finance are linked — the chart stops being merely a picture and becomes an active control panel.
Practical gains for PMs when Gantts are integrated:
- Real-time updates: field teams update progress via mobile; the schedule adjusts and stakeholders see current status immediately.
- Capacity-driven scheduling: the system checks team availability, qualifications and equipment before confirming dates.
- Automated rescheduling: changes cascade to dependent tasks and affected teams without manual edits.
- Actual vs planned metrics: track time and cost against the Gantt baseline to spot overruns early.
- Reduced communication overhead: notifications and task-level notes replace fragmented emails and calls.
- Single source of truth: one platform links documents, drawings, permits and change orders to schedule items.
- Faster handovers: work order creation, instructions and safety notes are generated directly from the schedule.
- Better financial control: quotes, purchase orders and invoices can be linked to tasks so revenue recognition follows delivery.
These capabilities transform the Gantt from a planning artefact into a living schedule that supports predictable delivery.
## Day-to-day examples where integration makes a difference
- Weather delay: A storm shifts work on one task. The connected system automatically alerts affected teams, reprioritises tasks using resource availability, and recalculates the critical path. You update the client with one status message instead of multiple calls.
- Urgent customer request: A high-priority job is added. The system checks crews with the right skills, moves non-critical tasks, and updates timesheets and cost estimates so you know the impact on margins.
- Scope change on site: The field team logs a change order via mobile. That entry links to the original task on your Gantt, updates cost forecasts and queues the approval and invoice processes.
- Cross-team dependencies: A materials delay is logged in procurement. The system flags downstream tasks on the Gantt, so you can reassign labour or adjust delivery dates before the delay becomes a crisis.
These are not hypothetical benefits — they are the operational improvements project managers ask for when moving beyond plan-only tools.
## How CQ complements your Gantt-based planning
CQ is positioned to extend what Gantt charts deliver: clear plans plus the operational systems needed to execute them reliably.
For a practical view of how Gantt scheduling links to everyday operations, see our project management software page: https://www.cq-business-management-software.com/project-management-software/. That page explains how scheduling, resource management and field workflows are connected in one platform.
If you want to evaluate the system in context, request a tailored demonstration at https://www.cq-business-management-software.com/landscaping-demo/ to see how schedules, timesheets and invoicing can flow from the same source of truth.
If you’re assessing options and need a framework for selection, read our guide on how to choose job management software: https://www.cq-business-management-software.com/how-to-choose-job-management-software/. It outlines the operational capabilities to look for beyond planning visuals.
In our experience working with service firms, the most successful teams keep Gantt charts for planning while moving execution, measurement and financials into a connected system. That combination reduces rework, improves utilisation and gives PMs the control they need.
## Practical next steps for project managers
If you rely on Gantt charts today and want to capture the operational benefits of a connected system, follow these steps:
- Map your process: list where information leaves the Gantt and how it is communicated to teams, finance and clients.
- Prioritise pain points: focus on the most disruptive gaps (double-bookings, manual re-planning, invoicing delays).
- Pilot integration: start with one region or project type and link scheduling to field updates and time capture.
- Define KPIs: measure schedule adherence, utilisation, margin variance and invoice cycle time before and after.
- Involve the field: mobile usability and simple workflows are critical for adoption.
- Iterate: use real projects to refine automations and approval paths.
Gantt charts are essential for planning. For reliable delivery, they need to sit inside systems that manage execution, finance and people. Connecting those pieces is the difference between a plan and predictable performance.
## Why teams lose control of projects
Projects fail not because people are incompetent but because information is scattered. Schedules sit in spreadsheets, quotes live in email threads, and site notes are scribbled on paper. The result is late jobs, duplicated effort and angry customers.
Across hundreds of demonstrations with growing service businesses, we consistently see the same weaknesses: task drift, double entry and opaque schedules that hide the real status of work. If your team relies on disconnected tools, you will spend time reconciling data instead of delivering value.
## The gap between teams and tasks
Silos create simple, avoidable problems:
- Field teams don’t get priority changes in real time.
- Office staff rekey job data into accounting and back-office systems.
- Managers can’t see which jobs are at risk until it’s too late.
Those problems escalate when multiple teams and subcontractors are involved. Visibility becomes both harder to achieve and more critical.
## How a unified platform fixes the problem
A unified project management system centralises job records, schedules, financials and communications. That reduces handoffs and removes the need to chase information across apps.
Connected workflows create operational visibility
When workflows are connected and the same job data flows from quoting to invoicing to reporting, your team can act decisively. That visibility stops issues early and frees managers to focus on exceptions rather than routine updates.
## What to expect from the right solution
A practical, business-focused platform should deliver:
- Single source of truth: one job record that all teams reference.
- Real-time scheduling: changes pushed to field devices instantly.
- Mobile-first field tools: job details, checklists and photos on site.
- Integrated financials: estimates, variations and invoicing that tie back to the job.
- Performance reporting: KPIs that expose delays and margin erosion.
These are not bells and whistles. They are controls that stop common causes of lost profit.
## Common resistance and how to overcome it
Resistance usually boils down to two fears: migration effort and loss of control. Address them directly.
- Start small: migrate one service line, prove the processes, then scale.
- Automate where it matters: remove duplicate entry points first (quotes to job to invoice).
- Train for outcomes: teach teams what success looks like (faster invoicing, fewer reworks).
If you need a clear framework for choosing software, read our practical guide at https://www.cq-business-management-software.com/how-to-choose-job-management-software/ which outlines the essential criteria and implementation checkpoints.
## Evidence from the field
We regularly see improvements when teams adopt a unified approach: faster invoicing cycles, clearer schedules and fewer site revisits. In our experience working with service businesses, the most immediate gains come from getting the field and office to operate from the same job record.
If you want to evaluate a platform in the context of your workflows, review the product overview at https://www.cq-business-management-software.com/ to understand core capabilities and architecture. To see how these capabilities apply to real-world operations, request a focused demonstration at https://www.cq-business-management-software.com/landscaping-demo/ where scenarios are matched to your typical jobs.
## A checklist to move from chaos to control
Before you buy, confirm the vendor can deliver on these practical items:
- Data mapping: Can they import your existing customers, jobs and pricing?
- Mobile reliability: Does the app work offline and sync reliably?
- Workflow automation: Can quotes drive job creation automatically?
- Reporting: Are the KPIs available without heavy configuration?
- Implementation support: Is there a clear plan and allocated resources?
If the answers are “yes”, you will remove most manual rework and get better control of margins.
## Start where the pain is worst
Fix the process that causes the biggest delay or drives the most cost. Centralise that workflow first, prove measurable improvement, then expand. That approach limits risk and delivers quick wins for your team.
Adopt a focused, practical path to unify your project management and you convert reactive firefighting into predictable delivery. Connected workflows create operational visibility — and visible operations are controllable operations.