In today's rapidly evolving business landscape, the nature and scope of risks have transformed dramatically. From cyber threats to global economic shifts, businesses face a myriad of challenges that require proactive risk management. Enter the world of technology, which offers a plethora of solutions to identify, assess, and mitigate these risks. Let's delve into how technology is revolutionizing risk mitigation.
The Landscape of Business Risks
Every business, regardless of its size or industry, grapples with a range of risks. These can be operational, stemming from internal processes; financial, related to market fluctuations; strategic, arising from business decisions; or compliance-based, linked to regulatory requirements. With the rise of global events, technological disruptions, and market dynamics, these risks are more unpredictable than ever.
Traditional vs. Technological Risk Management
Historically, businesses relied on manual assessments, past data, and human intuition to manage risks. While these methods have their merits, they lack the precision, speed, and proactive approach that today's business environment demands. This is where technology steps in, offering tools that are not only faster but also more accurate and comprehensive.
Technological Tools for Risk Identification
AI and Machine Learning: These technologies offer predictive analysis, allowing businesses to foresee potential risks based on current data trends.
Big Data Analytics: By analyzing vast amounts of data, businesses can identify patterns, anomalies, and potential threats that might have been overlooked in smaller datasets.
IoT Devices: Real-time monitoring and alerts ensure that businesses are immediately aware of any deviations or potential risks.
Solutions for Risk Assessment and Analysis
Simulation Software: Scenario planning tools allow businesses to visualize different risk scenarios and their potential impact.
AI-Powered Platforms: These tools provide accurate risk predictions, helping businesses prepare in advance.
Financial Risk Analysis Tools: For businesses, financial stability is paramount. These tools offer insights into market trends, currency fluctuations, and other financial risks.
Risk Response and Mitigation Technologies
Automated Response Systems: Immediate action can often prevent a potential risk from becoming a full-blown crisis. Automated systems ensure that the response is swift.
Blockchain: Especially relevant for businesses involved in transactions, blockchain offers a secure and transparent way to conduct business.
Cloud-Based Solutions: Data breaches are a significant risk. Cloud solutions offer secure data storage, backup, and recovery options.
Monitoring and Reporting Tools
Continuous monitoring is the key to effective risk management. Dashboards and visualization tools provide real-time insights, while automated reporting systems ensure that all stakeholders are kept in the loop. Moreover, integrating risk management tools with other business systems offers a holistic view of the business's health.
In Conclusion In the face of ever-evolving business risks, staying updated with the latest technological solutions is not just advisable; it's imperative. These tools offer businesses the best chance to not only identify and assess risks but also to respond in a timely and effective manner. As we move forward, investing in these technologies will be the cornerstone of sustainable and resilient business operations.
In the world of project management and planning, Gantt charts have emerged as indispensable tools that provide a visual representation of tasks, timelines, and dependencies. Developed by Henry L. Gantt in the early 20th century, Gantt charts have since become a cornerstone of project management, helping professionals across various industries streamline their processes, enhance communication, and ensure project success. In this article, we'll dive into the world of Gantt charts, exploring what they are, their components, and why they matter in modern business.
What Are Gantt Charts?
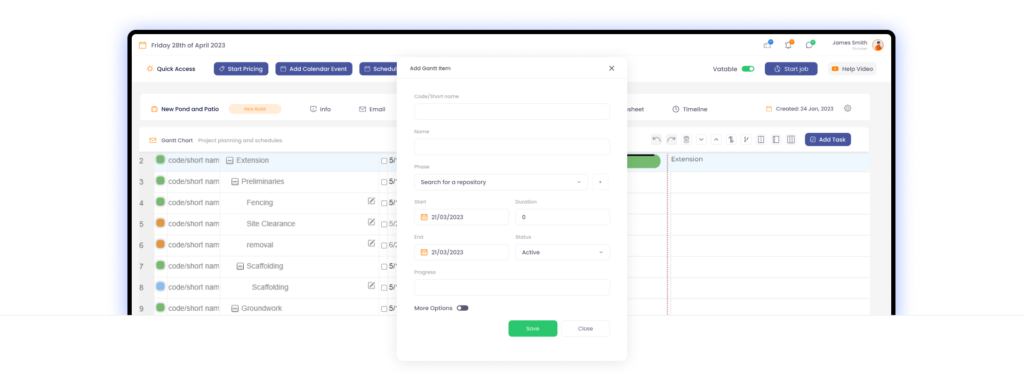
At its core, a Gantt chart is a visual representation of a project schedule over time. It displays a list of tasks or activities along with their corresponding start dates, end dates, and durations. Gantt charts provide a comprehensive overview of a project, allowing project managers and teams to see the big picture while also focusing on individual tasks.
Components of a Gantt Chart
To better understand Gantt charts, let's break down their key components:
Tasks or Activities: These are the individual work items or assignments that need to be completed as part of the project.
Timelines: Gantt charts display time horizontally, typically in days, weeks, or months, depending on the project's scale.
Dependencies: Tasks may be linked together to show relationships, indicating which tasks must be completed before others can start.
Gantt charts matter for several compelling reasons:
1. Enhanced Planning and Scheduling
Gantt charts provide a structured framework for planning and scheduling. Project managers can allocate resources efficiently, set realistic timelines, and assign tasks with clarity. This leads to more accurate project planning and execution.
2. Improved Communication
One of the key strengths of Gantt charts is their ability to convey complex project information in a simple and visual format. Team members and stakeholders can quickly grasp the project's status, task assignments, and deadlines, fostering better communication.
3. Visualization of Critical Path
Gantt charts make it easy to identify the critical path in a project—the sequence of tasks that, if delayed, would extend the project's overall duration. Recognizing the critical path allows for proactive management of potential delays.
4. Progress Tracking
As the project unfolds, Gantt charts serve as living documents that can be updated to reflect progress. Team members can mark completed tasks, and any deviations from the plan can be promptly addressed.
5. Resource Allocation
Efficient resource allocation is crucial for project success. Gantt charts help allocate resources effectively by showing when and where each resource is needed throughout the project's timeline.
Benefits of Using Gantt Charts
The advantages of using Gantt charts extend beyond the points mentioned above. Some additional benefits include:
Time Management: Gantt charts help in managing time effectively, ensuring that projects stay on track and meet deadlines.
Risk Reduction: By identifying potential bottlenecks and conflicts in advance, Gantt charts enable teams to proactively mitigate risks.
Stakeholder Engagement: Clients and stakeholders appreciate the transparency and clarity offered by Gantt charts, as they can easily follow project progress.
Team Collaboration: Teams work more cohesively when they have a clear visual representation of tasks and timelines.
Industries and Applications
Gantt charts are widely used across various industries and sectors, including:
In conclusion, Gantt charts are fundamental tools in project management software that provide a clear, visual roadmap for projects of all sizes and complexities. By offering a bird's-eye view of tasks, timelines, and dependencies, Gantt charts empower project managers and teams to plan effectively, communicate clearly, and ensure the successful execution of projects across diverse industries. Whether you're in construction, IT, marketing, manufacturing, or event management, understanding and harnessing the power of Gantt charts can significantly enhance your project management capabilities.
So, the next time you embark on a project, consider incorporating Gantt charts into your planning and management processes—they might just be the key to your project's success.
## Choosing the Right Technology to Improve Project Management
Project delivery fails for predictable reasons: unclear scope, scattered information, manual scheduling and reactive decision-making. If your team struggles with missed milestones, wasted labour and poor visibility, the problem is process and tools — not willpower. Choosing the right technology fixes the process problems that cause cost overruns and client dissatisfaction.
Across hundreds of demonstrations with growing service businesses, we consistently see the same weak points: fragmented data, siloed communications, and tools that don’t reflect on-site realities. Address those first; technology is an amplifier of process, not a silver bullet.
### What the right technology must solve
Connected workflows create operational visibility — and that visibility is what prevents rework, improves quoting accuracy and keeps teams on schedule. Any platform you evaluate must:
- Centralise job and client information so teams work from one source of truth.
- Link scheduling to actual resource availability and estimates.
- Allow field teams to update progress in real time, with photos and notes.
- Produce reliable, filterable reports for decisions at all levels.
- Integrate with your accounting and procurement systems to avoid duplicate data entry.
### Criteria to choose technology (practical checklist)
Evaluate vendors against these measurable criteria:
- Core capabilities: job scheduling, estimating, mobile job sheets, purchase orders, invoicing and timesheets.
- Integration: can it sync with your accounts package and other critical systems via API or native connectors?
- Usability: how quickly can field teams adopt the mobile app with minimal training?
- Reporting and dashboards: does it turn raw updates into actionable KPIs?
- Security and data governance: role-based access, backups and compliance.
- Deployment and onboarding: timeline, support model and training resources.
- Total cost of ownership: licences, implementation, customisation and future upgrades.
For a structured selection approach that organises these elements into a decision framework, see our guide on how to choose job management software: https://www.cq-business-management-software.com/how-to-choose-job-management-software/.
### Implementation focus areas — where projects succeed or fail
Most failures happen during rollout, not procurement. Address these execution risks:
- Start with a single, high-impact process (for example, quoting-to-scheduling) rather than attempting a “big bang”.
- Train supervisors and field leads first — they set the example.
- Define and enforce data standards (naming, job status, cost codes).
- Build integrations early for accounts and procurement to remove double handling.
- Measure adoption and adjust: track mobile logins, completed job updates and invoice lag.
You can explore a tailored example for service operations on our demo page to see how these elements come together in practice: https://www.cq-business-management-software.com/landscaping-demo/.
### Questions to ask vendors during evaluation
Ask for evidence, not promises. Useful questions include:
- Show live workflows from estimate to invoice. How does data travel between stages?
- How is offline field work handled and synchronised?
- What standard reports exist and how customisable are they?
- Provide customer examples that match your team size and service mix.
- What is your average implementation timeline and what resources do you require from us?
Assess the vendor’s product pages and integration information to verify these capabilities: https://www.cq-business-management-software.com/.
### Measuring success
Define clear, numeric targets before purchase:
- Reduce schedule conflicts by X% within three months.
- Shorten invoice lag to Y days.
- Improve quote-to-win ratio by Z%.
Monitor these metrics in the first 90 days and hold weekly review sessions with operational leaders to address adoption blockers.
### Final decision points
Choose a system that solves existing process failures, not the newest feature set. Prioritise:
- Operational fit over feature overload.
- Integration and data accuracy over customisation complexity.
- Rapid, staged adoption over extended pilot projects.
Technology should reduce friction and make good processes visible and repeatable. If you need to see how a complete solution handles real-world workflows and reporting, request a demonstration that matches your use case on our main software page: https://www.cq-business-management-software.com/.
Effective communication is the lifeblood of any successful project. It ensures that teams are aligned, stakeholders are informed, and objectives are met. However, when communication breaks down, the financial consequences can be significant. In this article, we'll explore the financial implications of poor communication in projects and offer strategies to improve communication for better financial outcomes.
The Cost of Miscommunication
Rework and Delays: Miscommunication often leads to mistakes that require costly rework. For instance, if a team member misunderstands a task and completes it incorrectly, not only is there the cost of redoing the task, but there's also the cost associated with project delays. Waiting for clarifications or corrections can push project timelines, leading to increased operational costs.
Increased Operational Costs: Extended project timelines due to miscommunication mean higher operational costs. Whether it's paying staff for extra hours, renting equipment for longer periods, or incurring additional administrative expenses, the costs add up. Additionally, conflicts arising from miscommunication can lead to mediation expenses, further straining the budget.
Missed Opportunities: A project that suffers from chronic miscommunication can tarnish a company's reputation. This can lead to lost business opportunities and the cost of time when teams are not working cohesively.
The Ripple Effect of Poor Communication
Stakeholder Dissatisfaction: When there's a lack of clear communication, stakeholder expectations might not be met. This can lead to dissatisfaction, which might result in financial penalties or lost future business opportunities.
Team Morale and Productivity: Poor communication can lead to frustration among team members. This can result in high turnover rates, with the company incurring recruitment and training costs. Moreover, when team morale is low, productivity suffers, leading to extended project timelines and increased costs.
Legal Implications: Miscommunication can sometimes have legal repercussions. Whether it's a breach of contract due to unmet deliverables or penalties for not adhering to regulations, the financial burden can be substantial.
Strategies for Improving Communication
Invest in Training: One of the best ways to improve communication is through training. Workshops and training sessions can equip team members with the skills they need to communicate effectively. The return on investment is clear: fewer mistakes, better team alignment, and improved stakeholder satisfaction.
Leverage Technology: There are numerous tools and software available that facilitate clear communication. Project management platforms, for instance, can help teams stay updated on project progress, while communication platforms can ensure that everyone is on the same page.
Regular Check-ins and Feedback Loops: Regular team meetings and updates are crucial. They ensure that everyone is aligned and any issues are addressed promptly. Feedback loops, where team members can voice concerns or offer suggestions, can also help in preventing costly mistakes.
Conclusion
The financial benefits of effective communication in projects are clear. By ensuring that everyone is aligned, that stakeholders are informed, and that objectives are met, projects can be completed on time and within budget. It's crucial for businesses to recognize the importance of communication and to invest in strategies that promote clear and effective communication.
In today's fast-paced business environment, efficient asset management is critical for success. Assets, ranging from machinery and equipment to digital resources, form the backbone of any organization. Traditionally, managing these assets involved manual processes, spreadsheets, and multiple software tools, leading to inefficiencies, errors, and operational bottlenecks. However, the future of asset management looks promising with the emergence of integrated software solutions that streamline operations, enhance visibility, and offer predictive insights.
The Traditional Challenges
Before diving into the future, let's first understand the challenges associated with traditional asset management methods. Many businesses still rely on paper-based records or standalone software tools to manage their assets. This approach often results in:
Limited Visibility: Lack of real-time data access makes it challenging to track asset status and location accurately.
Data Silos: Disparate systems create data silos, preventing seamless communication between departments.
Manual Processes: Time-consuming manual processes for asset tracking, maintenance scheduling, and auditing.
Data Inaccuracy: Human errors and outdated information lead to inaccurate asset records.
These challenges have prompted businesses to seek more efficient ways to manage their assets, and that's where integrated software solutions come into play.
The Rise of Integrated Asset Management Software
Integrated asset management software, also known as Enterprise Asset Management (EAM) or Computerized Maintenance Management System (CMMS), integrates various asset-related functions into a single, cohesive platform. This software unifies asset tracking, maintenance, procurement, and analytics, providing a holistic view of asset lifecycles.
Benefits of Integrated Asset Management Software
Cost Savings: Integrated software eliminates manual processes, reducing labor costs and the risk of errors.
Efficiency Improvements: Automation of asset tracking and maintenance schedules leads to faster response times and reduced downtime.
Data Accuracy: Real-time data updates ensure that asset information is always current and accurate.
Streamlined Auditing: Integrated systems simplify auditing processes, helping businesses comply with regulations more effectively.
Enhanced Reporting: Access to comprehensive data enables better decision-making and strategic planning.
Predictive Maintenance: Machine learning algorithms can predict asset failures, allowing for proactive maintenance and preventing costly breakdowns.
IoT Integration: Integration with the Internet of Things (IoT) enables real-time monitoring of asset conditions, further enhancing predictive maintenance capabilities.
Streamlining Operations with Integration
The true power of integrated asset management software lies in its ability to streamline operations. Here's how it accomplishes this:
Centralized Data: All asset-related data resides in one location, providing a single source of truth for the entire organization.
Cross-Departmental Collaboration: Integrated software breaks down data silos, enabling seamless communication and collaboration between departments.
Real-Time Tracking: With real-time tracking capabilities, businesses can monitor asset location, condition, and usage at any given moment.
Automated Workflows: Maintenance requests, work orders, and procurement processes can be automated, reducing administrative burdens.
Data-Driven Insights: Advanced analytics provide actionable insights, helping organizations make informed decisions about asset maintenance, replacements, and investments.
Future Trends and Innovations
The future of asset management holds exciting possibilities:
IoT and AI Integration: The integration of IoT sensors and artificial intelligence will enable even more precise predictive maintenance, reducing costs and extending asset lifecycles.
Blockchain for Asset Tracking: Blockchain technology will enhance the security and transparency of asset tracking records, especially in supply chain management.
Augmented Reality (AR): AR tools will assist technicians in performing maintenance tasks, offering real-time guidance and reducing human errors.
Choosing the Right Integrated Software
When selecting integrated asset management software, consider factors like scalability, ease of integration with existing systems, user-friendliness, and the vendor's track record. It's crucial to align the software's features with your organization's specific needs.
Conclusion
The future of asset management is undeniably tied to integrated software solutions. Businesses that embrace this technology are poised to experience substantial improvements in efficiency, cost savings, and strategic decision-making. To thrive in a rapidly evolving business landscape, investing in integrated asset management software is not just an option; it's a necessity.
In the dynamic world of construction, where projects range from small renovations to massive infrastructural developments, financial tracking is paramount. The financial health of a construction business can be the difference between its success and failure. This article delves into the essential financial metrics that every construction business should monitor to ensure profitability and sustainable growth.
Understanding Financial Metrics in Construction
Financial metrics provide quantifiable measures that help businesses assess their performance, profitability, and financial health. In the construction industry, these metrics are tailored to address the unique challenges and operational nuances of the sector. They offer insights into project profitability, operational efficiency, and financial stability, guiding businesses in making informed decisions.
Key Financial Metrics to Monitor
Profit Margin: Profit margin is a critical metric that indicates the profitability of your projects. It's calculated by subtracting the total costs of a project from its revenue and then dividing by the revenue. A higher profit margin indicates better profitability. To improve profit margins, consider optimizing operational processes, renegotiating supplier contracts, and enhancing project management strategies.
Overhead Rate: Overhead costs, such as administrative expenses and office rentals, are inevitable. The overhead rate is calculated by dividing total overhead costs by total revenue. A lower rate is preferable, indicating that a larger percentage of revenue is profit. To manage overhead costs, regularly review expenses, and consider areas for cost-saving.
Work in Progress (WIP) Reports: WIP reports provide a snapshot of ongoing projects, tracking costs, billings, and the percentage of completion. Regularly updating WIP reports helps in identifying potential financial issues early, ensuring that projects remain on budget.
Debt-to-Equity Ratio: This metric offers insights into a company's financial leverage by comparing its total liabilities to shareholders' equity. A lower ratio suggests that the company relies less on external debts. While there's no one-size-fits-all ideal ratio, construction businesses should aim for a balance that aligns with their financial strategy.
Current Ratio: The current ratio measures a company's ability to cover its short-term liabilities with its short-term assets. A ratio above 1 indicates that the company can comfortably meet its short-term obligations. Regularly monitoring the current ratio helps businesses maintain liquidity.
Return on Investment (ROI) for Projects: ROI measures the profitability of individual projects. It's calculated by dividing the net profit of a project by its costs. A higher ROI indicates a more profitable project. Evaluating ROI helps businesses prioritize projects and allocate resources efficiently.
Utilizing Technology for Financial Tracking
With advancements in technology, construction businesses now have access to specialized accounting software and tools designed to simplify financial tracking. Automating financial processes reduces errors, saves time, and provides real-time insights. When choosing a financial tracking tool, look for features like automated invoicing, real-time budget tracking, and integration capabilities with other operational tools.
Regularly Reviewing and Adjusting
Financial metrics are not static. They offer the most value when reviewed periodically. Regular reviews allow businesses to spot trends, address potential issues, and adjust strategies based on financial insights. Whether it's reallocating resources or renegotiating contracts, proactive decision-making based on financial metrics can significantly impact a construction business's bottom line.
Conclusion
Financial tracking is the backbone of a successful construction business. By understanding and monitoring key financial metrics, construction businesses can ensure their projects are profitable, operations are efficient, and the company is financially stable. As the construction landscape continues to evolve, staying informed and proactive in financial management will pave the way for long-term success.
## The problem: quality assurance is still an afterthought
Too many teams treat quality assurance as a checklist at handover rather than a core operational discipline. That approach means defects are caught late, rework grows, client satisfaction slips and margins erode.
Common failure points are predictable:
- Fragmented information between office and site.
- Manual inspections that are slow to record and even slower to action.
- No single source of truth for drawings, specifications and defect logs.
- Inconsistent supplier and subcontractor performance with no auditable trail.
These issues are operational, not technical. Fix them through process design and disciplined execution.
## Build quality into the way you work
Quality assurance must be embedded in everyday operations, not bolted on. That requires clear responsibilities, consistent checkpoints and digital systems that enforce the process.
Across hundreds of demonstrations with growing service businesses, we consistently see teams that move from paper to structured digital workflows reduce defects and close them faster. The steps these teams take are repeatable:
- Define the acceptance criteria for each deliverable before work starts.
- Break work down into measurable stages with required checks at each handover.
- Digitise inspection templates and make them part of every job.
- Capture photographic proof and versioned documents on site.
- Route issues automatically to the responsible party with deadlines and escalation.
Connected workflows create operational visibility — you must be able to see, in real time, where every check stands and who is accountable.
## What digital QA looks like in practice
A practical quality-assurance system needs to do three things reliably:
1. Prevent defects
- Standardise materials and methods.
- Use pre-task briefings and competency checks.
2. Detect defects early
- Mobile inspections with mandatory fields and photos.
- Automated triggers when a check fails.
3. Resolve defects quickly
- Assign corrective tasks with owners and SLAs.
- Track closure and verify remedial work.
For a clear picture of how these elements combine in a job management platform, see https://www.cq-business-management-software.com/.
## Practical actions your team can take this week
If you want to reduce rework in the short term, implement these measures immediately:
- Replace paper sign-offs with a single mobile inspection form.
- Require one photo per inspection point and an auto-generated timestamp.
- Assign responsibility for each defect with a 48–72 hour SLA.
- Hold a weekly QA review meeting that focuses only on trends and repeat issues.
- Log supplier performance and make retention conditional on improvement.
These actions create structure fast and make problems visible before they become costly.
## How to choose a platform that enforces QA
Selecting software is a tactical step. Focus on capabilities not features. The decision criteria that matter:
- Can it enforce workflows and not just record data?
- Does it integrate documents, photos and communications into one job record?
- Can you report on defect rates, time-to-close and supplier performance?
- Is the system usable by crews on site without adding admin time?
If you need a checklist for vendor selection, follow a practical guide at https://www.cq-business-management-software.com/how-to-choose-job-management-software/.
If you prefer to see the day‑to‑day workflows in action, request a demo at https://www.cq-business-management-software.com/landscaping-demo/.
## KPIs that prove quality is improving
Measure what matters. Track these KPIs weekly:
- Defects per 100 tasks
- Average time to close defects
- Percentage of jobs passing first inspection
- Supplier defect rate
- Cost of rework as a percentage of job value
These metrics tell you whether your changes are working or just creating more paperwork.
## Final point: QA is operational, not optional
Quality assurance is a discipline you build into your processes. It starts with defined acceptance criteria, uses digital workflows to enforce checks and relies on accountability to close the loop. Make the process visible, measure it and act on the trends.
If you want to see how this looks in practice for service businesses and teams, see the platform overview at https://www.cq-business-management-software.com/.
The construction industry, with its vast projects and significant investments, often grapples with financial challenges. Predicting financial outcomes has become not just a strategy but a necessity. This article delves into the world of financial forecasting in construction, highlighting its importance and the tools available to ensure accurate predictions.
Understanding Financial Forecasting
Financial forecasting is the process of estimating future financial outcomes based on historical data and analysis. While it might sound similar to budgeting, the two are distinct. Budgeting outlines how a business expects to spend its resources, while forecasting predicts the resources a business will have at its disposal. In the volatile world of construction, forecasting becomes a beacon, guiding businesses through uncertain terrains.
Benefits of Financial Forecasting in Construction
Improved Cash Flow Management: With accurate forecasting, businesses can ensure they have enough cash on hand to meet their obligations, from paying suppliers to settling salaries.
Better Resource Allocation: Predicting financial outcomes allows businesses to allocate resources more efficiently, ensuring that projects are neither over-resourced nor under-resourced.
Risk Mitigation and Management: By anticipating potential financial pitfalls, businesses can devise strategies to mitigate risks.
Enhanced Stakeholder Confidence: Accurate financial forecasts can boost the confidence of stakeholders, from investors to clients.
Informed Decision-making: With a clear financial roadmap, businesses can make informed decisions about future projects, investments, and expansions.
Tools and Techniques for Financial Forecasting
The traditional methods of spreadsheets and historical data analysis, while still relevant, are now complemented by modern tools. Financial forecasting software, powered by AI-driven predictions, offers more accurate and timely forecasts. Additionally, data analytics plays a pivotal role in refining these predictions, ensuring they are rooted in reality.
Challenges in Financial Forecasting for Construction
The construction industry is inherently unpredictable. External factors such as economic downturns, regulatory changes, and fluctuations in material prices can throw a wrench in the most well-planned forecasts. This unpredictability underscores the importance of regularly updating and adjusting forecasts to reflect the current reality.
Best Practices for Effective Financial Forecasting
Collaborative Data Collection: Engage all departments, from procurement to project management, to gather comprehensive data.
Regular Reviews: Financial landscapes change. Regularly review and adjust your forecasts to stay relevant.
Training and Upskilling: Ensure your team is equipped with the latest forecasting techniques and tools.
Leverage Technology: Embrace software solutions and AI-driven tools for more accurate and efficient forecasting.
In Conclusion Financial forecasting is not just a tool but a necessity for construction businesses aiming for growth and success. With the right approach, tools, and mindset, businesses can navigate the unpredictable waters of the construction industry with confidence. As we move forward, the emphasis on accurate financial forecasting will only grow, making it an indispensable part of the construction business toolkit.
In an era of data-driven insights and digital transformation, the construction industry is experiencing a profound shift in the way decisions are made. Big data, a term that encapsulates the vast and diverse sets of data generated in construction projects, is playing a pivotal role in transforming decision-making processes. In this article, we'll explore the significance of big data in construction and how it is reshaping the industry's decision landscape.
Understanding Big Data
Before delving into its impact, it's essential to understand what big data entails. Big data comprises vast volumes of information generated at high velocity from diverse sources within the construction ecosystem. This data encompasses project schedules, cost estimates, equipment performance, environmental conditions, and much more. It's characterized by its volume, velocity, variety, and veracity.
Traditional Decision-Making Challenges in Construction
Historically, construction decision-making faced numerous challenges. Decision-makers often operated in information silos, relying on fragmented data sources, and making decisions based on intuition rather than data-driven insights. This approach led to inefficiencies, cost overruns, and project delays.
The Paradigm Shift: Big Data in Construction
The construction industry has witnessed a significant paradigm shift with the adoption of big data analytics. Here's how big data is revolutionizing construction decision-making:
1. Improved Accuracy:
Big data analytics provide decision-makers with access to a wealth of information that enhances the accuracy of decisions. Data-driven insights enable project teams to make informed choices about resource allocation, project schedules, and risk mitigation.
2. Efficiency Enhancement:
Big data streamlines project workflows and processes. Real-time data monitoring and analysis enable teams to optimize construction schedules, allocate resources more efficiently, and reduce waste.
3. Cost Savings:
Data-driven decision-making leads to cost savings through efficient resource allocation and early identification of cost overruns. By proactively addressing issues, construction companies can keep projects within budget.
Data Sources in Construction
Big data in construction is sourced from a multitude of channels:
IoT Sensors: Sensors on equipment and machinery provide real-time data on performance and conditions.
Project Management Software: Software platforms capture data on project schedules, progress, and cost estimates.
Environmental Sensors: Data on weather conditions, air quality, and other environmental factors are collected for analysis.
BIM Models: Building Information Modeling generates data-rich 3D models that inform decision-making during design and construction.
Benefits of Big Data in Construction Decision Making
The adoption of big data analytics in construction brings several benefits:
1. Real-time Decision-Making:
Construction professionals can access real-time data, enabling them to make immediate decisions and respond to emerging challenges promptly.
2. Efficiency Gains:
Streamlined workflows and optimized resource allocation result in improved efficiency and project timelines.
3. Cost Reduction:
Data-driven insights help identify potential cost overruns and areas for cost reduction, ultimately improving project profitability.
Case Studies and Examples
Real-world examples illustrate the power of big data in construction. Projects that have embraced data analytics have experienced significant reductions in project delays, improved cost control, and enhanced overall project outcomes.
Challenges and Considerations
While the benefits of big data are substantial, there are challenges to consider:
Data Privacy and Security: Protecting sensitive project data is essential to prevent breaches and ensure compliance with regulations.
Data Integration: Integrating data from various sources and systems can be complex but is crucial for comprehensive analysis.
Skillset Development: Training construction professionals in data analytics is necessary to fully harness the potential of big data.
Future Trends in Big Data for Construction
The future of big data in construction holds promise:
1. Predictive Analytics:
Predictive models will become more sophisticated, allowing construction teams to anticipate risks and optimize schedules and resources.
2. AI and Machine Learning:
AI-powered algorithms will uncover valuable insights from big data, providing recommendations for optimal decision-making.
Practical Tips for Implementation
For construction professionals looking to leverage big data, consider the following:
Select the Right Tools: Choose data analytics tools that align with your project needs and objectives.
Data Governance: Develop robust data governance policies to ensure data quality, privacy, and security.
Skills Development: Invest in training to equip your team with the necessary skills for data analysis.
Conclusion
Big data is revolutionizing the construction industry's decision-making landscape. With access to real-time data, construction professionals can make more accurate, efficient, and cost-effective decisions. As the industry continues to embrace data-driven insights, the role of big data in construction decision-making will only grow in significance.
Effective communication is the lifeblood of any successful organization. It's the glue that holds teams together, drives productivity, and fosters a positive work environment. However, despite its importance, communication in the workplace often encounters various barriers that can hinder understanding and collaboration. In this article, we'll explore common communication barriers and provide practical strategies for overcoming them, ultimately leading to more harmonious and productive workplaces.
The Importance of Effective Communication
Before we dive into the barriers and solutions, let's establish why effective workplace communication is so vital. In essence, it serves as the backbone of any successful organization for several key reasons:
Effective communication fosters a sense of unity among team members. When colleagues can easily exchange ideas, provide feedback, and collaborate, the quality of work improves.
3. Boosts Employee Satisfaction
A workplace where employees feel heard and understood is a happier one. Good communication helps address concerns, reduce stress, and enhance job satisfaction.
To address communication issues, it's crucial to recognize the most common barriers that can impede effective workplace communication:
1. Language Differences
In diverse workplaces, language disparities can lead to misunderstandings. This is especially true in global companies where employees speak different languages.
2. Lack of Clarity
Unclear messages, jargon, or overly technical language can confuse recipients and hinder comprehension.
3. Misinterpretations
People often interpret messages differently based on their own perspectives and biases, leading to miscommunication.
4. Technology Challenges
While technology has improved communication, it can also create barriers. For example, misunderstandings can arise from email miscommunications or overreliance on digital communication.
Strategies for Overcoming Communication Barriers
Now that we've identified these barriers, let's explore strategies to overcome them and promote effective workplace communication:
1. Cultural Sensitivity
Promote cultural sensitivity and awareness among employees.
Offer diversity training to help colleagues understand and appreciate different cultures and communication styles.
2. Active Listening
Encourage active listening, where employees focus on understanding rather than responding.
Use techniques like paraphrasing to confirm understanding during conversations.
3. Clarity and Transparency
Prioritize clarity in your communication. Use simple language and avoid jargon.
Double-check messages for clarity before sending them, especially in written communication.
4. Constructive Feedback
Encourage a culture of constructive feedback. Provide guidance on giving and receiving feedback effectively.
Develop a clear conflict resolution process that encourages open and respectful communication.
Ensure that employees know how to address conflicts constructively.
6. Nonverbal Communication
Train employees to be aware of nonverbal cues, such as body language, tone of voice, and facial expressions.
Use these cues consciously to convey messages accurately.
7. Technology Best Practices
Implement guidelines for email and digital communication, emphasizing clarity and professionalism.
Consider using video conferencing or phone calls for sensitive or complex conversations.
Measuring Progress
To ensure that these strategies are making a difference, it's essential to measure communication effectiveness. This can be achieved through employee feedback surveys, periodic evaluations, and monitoring key communication metrics.
Conclusion
In the fast-paced world of work, effective communication is the linchpin that holds everything together. By recognizing and addressing common communication barriers, organizations can create environments where employees feel heard, understood, and empowered to excel. When communication flows smoothly, productivity soars, teamwork thrives, and job satisfaction blossoms. Start breaking down those barriers today, and watch your workplace transform into a hub of efficient and harmonious collaboration.
In the realm of project management, Gantt charts have long been revered for their ability to visualize project timelines and tasks. Developed by Henry L. Gantt in the 1910s, these charts have played a pivotal role in keeping projects on track for over a century. However, in today's digital age, Gantt charts have evolved beyond their humble origins, thanks to integration with modern project management software.
The Basics of Gantt Charts
Before delving into the digital transformation of Gantt charts, let's start with the basics. Gantt charts are horizontal bar charts that represent project tasks, their durations, and the dependencies between them. They provide a visual snapshot of how a project is progressing, making it easier to manage timelines and allocate resources efficiently.
Challenges in Traditional Gantt Chart Usage
While traditional Gantt charts have been valuable tools, they come with limitations, especially when handling complex projects with numerous dependencies. Maintaining these charts manually can be time-consuming, and changes or updates often require manual adjustments, risking errors and miscommunication.
Integration with Project Management Software
Enter the digital age, where Gantt charts are no longer static diagrams but dynamic tools integrated with project management software. This integration has revolutionized the way project managers plan, execute, and monitor projects.
By connecting Gantt charts to project management software, project managers gain access to real-time updates and a collaborative environment. This means that changes made by one team member are instantly reflected in the chart visible to everyone involved. No more emailing updated charts or reconciling conflicting versions—everyone is on the same page.
Enhanced Visualization with Integration
Integration enhances project visualization significantly. Modern Gantt charts can display not only tasks and timelines but also resource allocation, dependencies, and critical paths. This holistic view empowers project managers to make informed decisions, identify potential bottlenecks, and allocate resources effectively.
With dependencies visually represented, it becomes easier to understand how delays in one task can impact the entire project. Project managers can take proactive measures to mitigate risks and ensure smoother project execution.
Real-time Data and Progress Tracking
In the digital age, real-time data is king. Integrated Gantt charts provide exactly that. Project managers can track progress as it happens, rather than relying on periodic updates. This real-time insight enables quicker decision-making and ensures that projects stay on course.
Imagine a construction project where changes in the delivery schedule of raw materials can impact the entire timeline. Integrated Gantt charts provide the visibility needed to respond swiftly to such changes, reducing downtime and costs.
Collaboration and Communication
Integration fosters seamless collaboration within project teams. Team members can access Gantt charts from anywhere with an internet connection, eliminating geographical barriers. They can also leave comments, ask questions, and share updates directly within the chart, streamlining communication.
Clear communication is crucial for project success, and integrated Gantt charts serve as a central hub for discussions and information sharing. This ensures that everyone involved is aligned and informed.
Customization and Flexibility
Integrated Gantt charts are highly flexible and customizable to suit various project types and industries. Project managers can tailor charts to meet specific needs, whether they are managing a software development project, a marketing campaign, or a construction project.
Customization options include adding custom fields, color-coding tasks, and setting up notifications for critical milestones. This adaptability allows project managers to create Gantt charts that align with their unique project requirements.
In conclusion, Gantt charts have seamlessly transitioned into the digital age, thanks to integration with modern project management software. They are no longer static diagrams on paper but dynamic tools that empower project managers to visualize, track, and execute projects with precision. Embracing this transformation can significantly enhance project management and ultimately lead to better project outcomes in today's fast-paced business environment.
In the age of digital transformation, businesses are inundated with data. This data, when harnessed correctly, can provide invaluable insights into future trends and growth trajectories. Enter predictive analytics—a game-changer in the realm of business analytics.
What is Predictive Analytics?
Predictive analytics is the use of data, statistical algorithms, and machine learning techniques to identify the likelihood of future outcomes based on historical data. It goes beyond traditional descriptive analytics, which merely describes what has happened, and ventures into the realm of predicting what might happen next. This foresight is invaluable for businesses aiming to stay ahead of the curve.
The Role of Predictive Analytics in Business Growth
Predictive analytics is not just about number-crunching; it's about gleaning actionable insights from those numbers. By identifying trends, patterns, and anomalies in vast datasets, businesses can make informed decisions about future strategies. For instance, an e-commerce platform might use predictive analytics to forecast sales during the holiday season, allowing for better stock management and marketing strategies.
Benefits of Predictive Analytics
Improved Decision-Making: With data-driven insights at their fingertips, businesses can make decisions that are not based on gut feelings but on solid evidence.
Enhanced Customer Targeting: Predictive analytics can help businesses understand their customers better, leading to more personalized marketing campaigns.
Risk Mitigation: By predicting potential pitfalls, businesses can proactively address issues before they escalate.
Optimized Resource Allocation: Predict where resources are most needed and allocate them efficiently.
Key Tools and Techniques
The world of predictive analytics is rich with tools and techniques. Popular tools include Python libraries like Scikit-learn, R for statistical computing, and platforms like SAS. Machine learning models, especially regression models and neural networks, play a pivotal role in making accurate predictions. Additionally, big data platforms like Hadoop and Spark have made it easier to process and analyze vast amounts of data.
Challenges and Considerations
While predictive analytics offers numerous benefits, it's not without its challenges. Data privacy is a significant concern, especially with regulations like GDPR in place. Moreover, predictive models are only as good as the data they're trained on. Continuous model training and refinement are crucial to ensure accuracy.
Steps to Implement Predictive Analytics in Your Business
Assess Your Data Capabilities: Before diving in, understand your current data infrastructure.
Define Clear Objectives: Know what you want to achieve with predictive analytics.
Collaborate with Experts: Whether it's an in-house data scientist or an external consultant, get the right people on board.
Monitor and Iterate: Predictive analytics is not a one-time task. Continuously monitor your models and refine them as needed.
Conclusion
Predictive analytics holds the promise of transformative growth for businesses. By forecasting future trends and challenges, businesses can strategize proactively, ensuring they're always one step ahead. In the ever-evolving business landscape, predictive analytics is not just a tool; it's a necessity.
Don't let your business be left behind. Dive into the world of predictive analytics and harness the power of data-driven growth forecasting.